Read the macro.
Trade the flow.
MacroHub puts the economy, rates, earnings and valuation in one terminal, and MTS adds quant signals, dealer gamma, options activity and volatility. One membership, every tool.
3-day free trial · $0 due today
Tour the terminal
From backdrop to trade
Real MacroHub and MTS screens, shown with sample data. Switch between the Cards and Terminal looks at any step: members pick either inside the app.
01 Read the regime
02 Check the positioning
03 Plan the trade
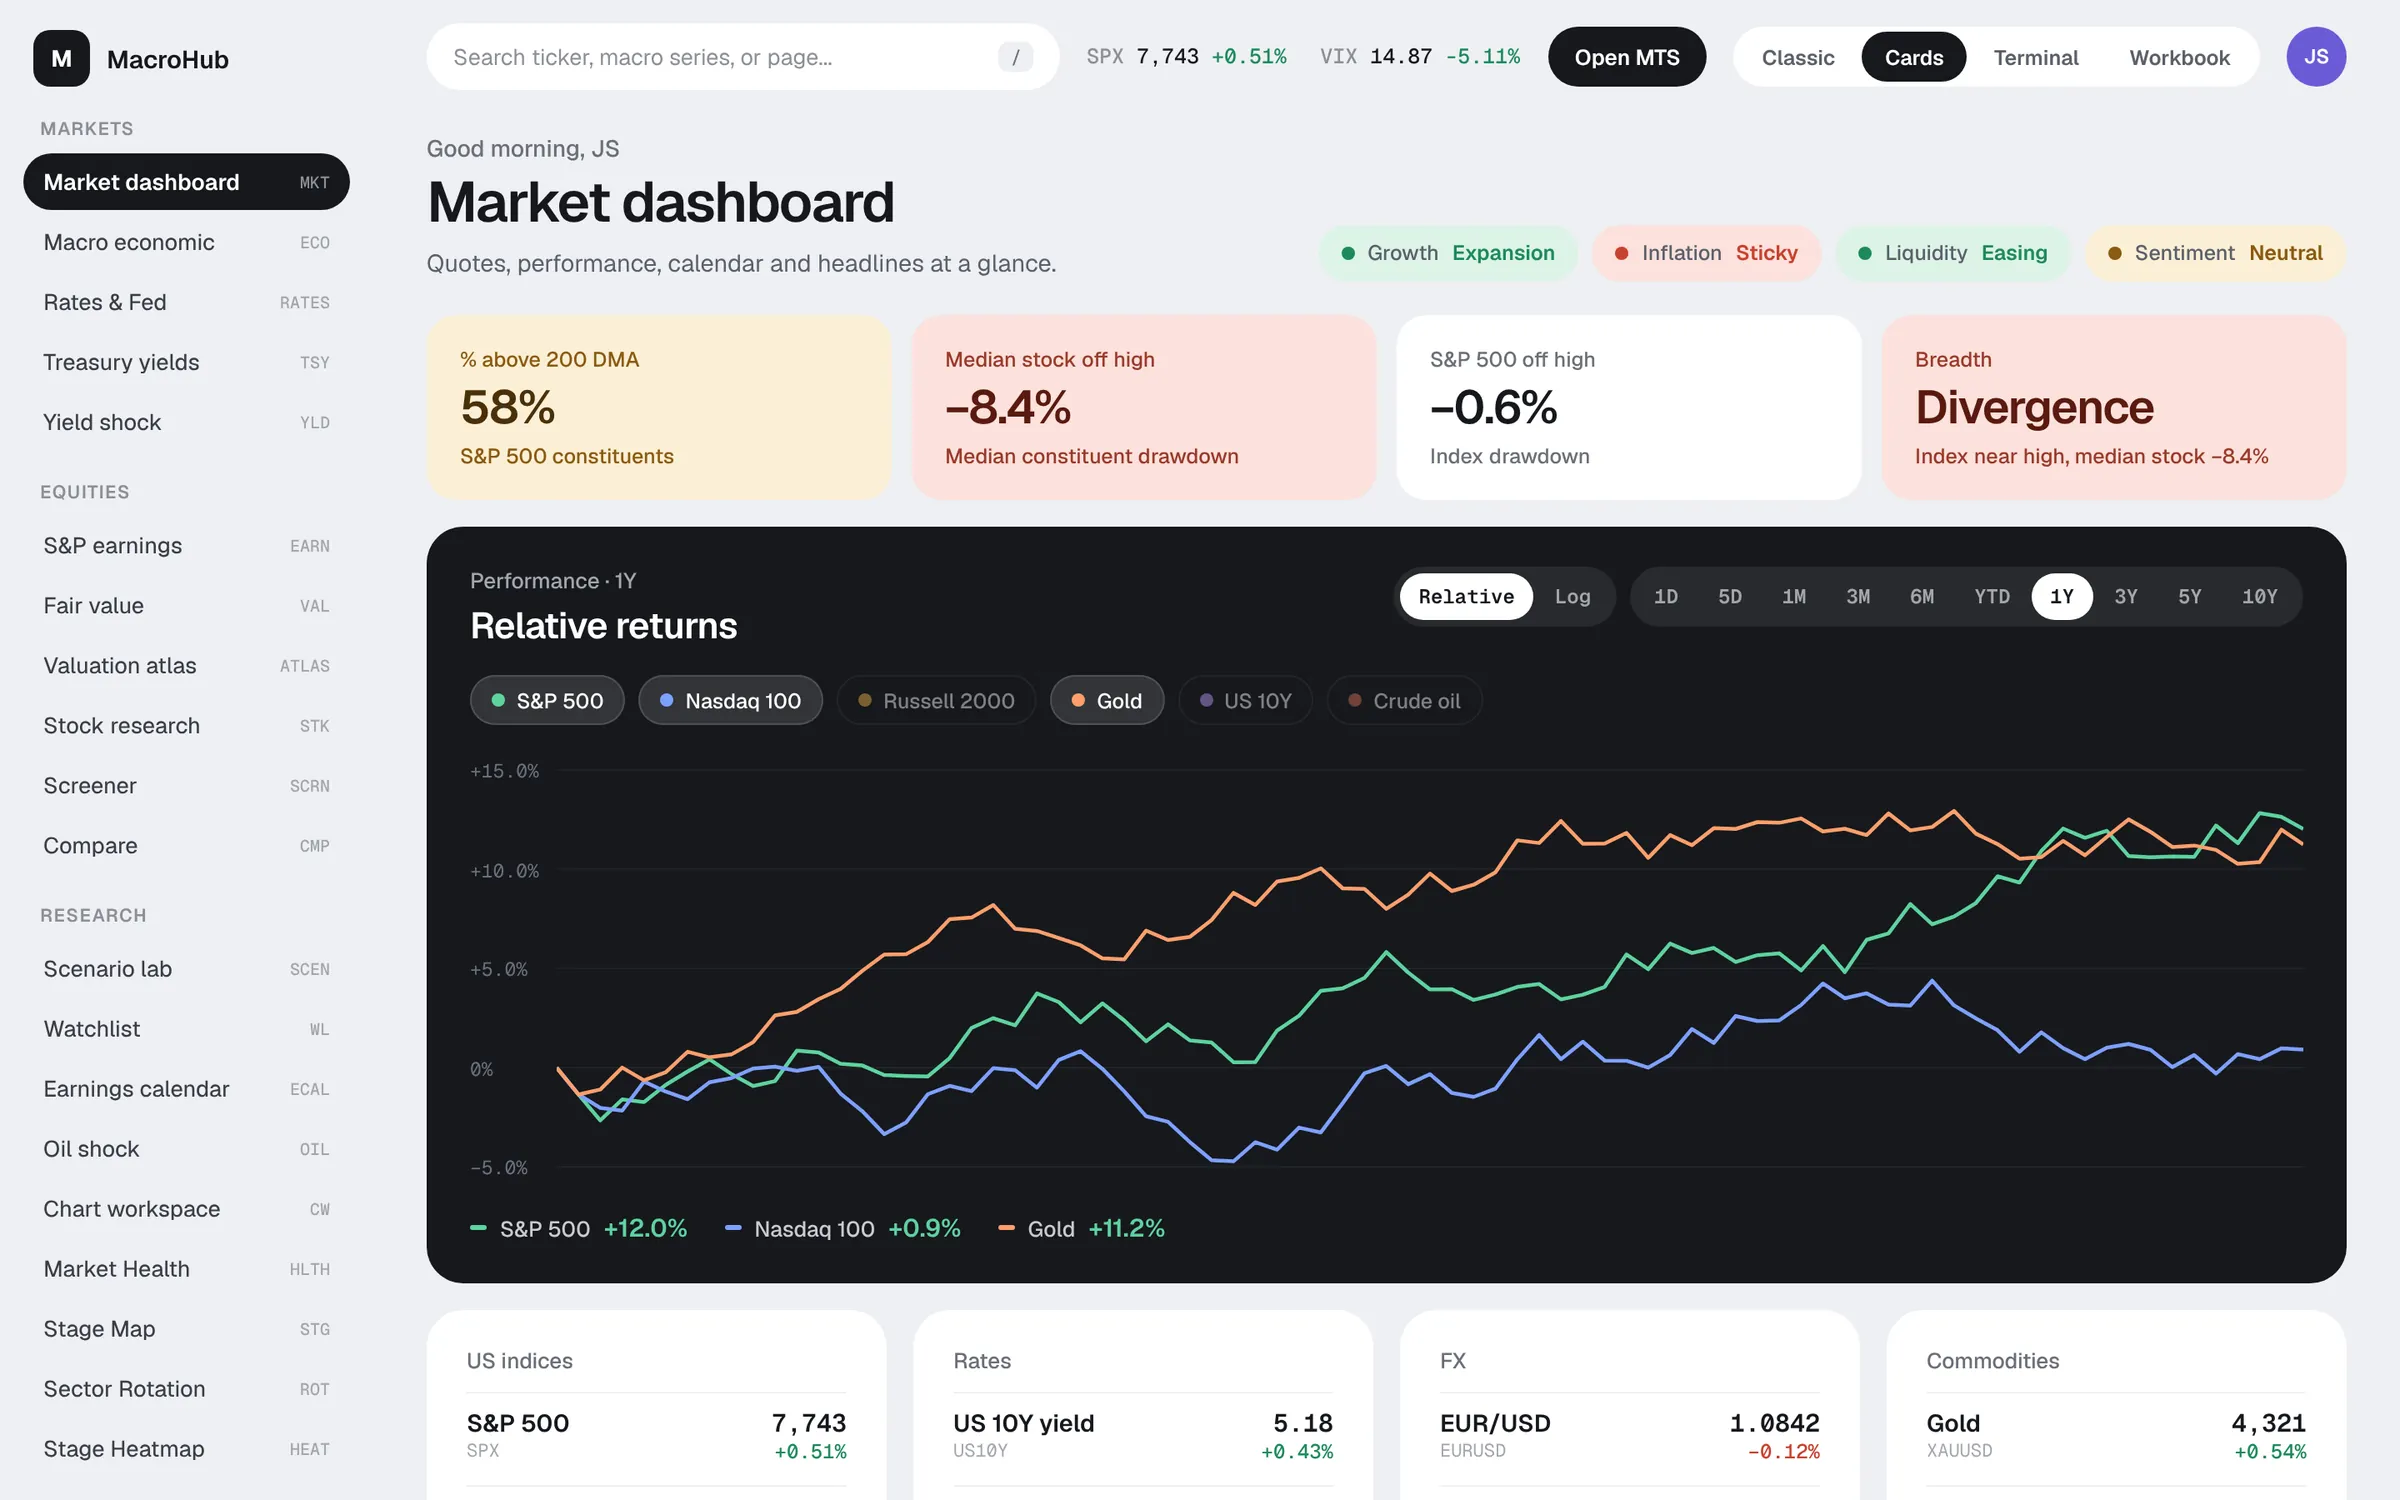
MacroHubRead the regime
Start with the tape
- Regime chips for growth, inflation, liquidity and sentiment.
- Breadth at a glance: share above the 200-day, median drawdown, divergence.
- Relative returns across indices, gold, yields and oil, from 1 day to 10 years.
The toolkit
Every tool a macro trader reaches for
Each screen answers one question you ask before a trade. Start with the backdrop in MacroHub, then move to positioning and execution in MTS.
MacroHub terminal
The macro backdrop, company research and scenario tools.
Market dashboard
Cross-asset quotes, movers and breadth on one screen.
Macro economy
Growth, jobs, inflation and leading indicators for the US, UK and Europe.
Rates & Treasuries
The Fed path, rate expectations and the whole Treasury curve.
Macro Trap scanner
One risk score built from the curve, liquidity, credit and debt dynamics.
Earnings & fair value
Forward EPS bands, valuation zones and multi-model fair value.
Stock research
Screen, compare and model 4,000+ US companies from their SEC filings.
Stages & rotation
Stage maps, sector rotation and market-health scans.
Scenario tools
Stress-test portfolios against a yield shock or an oil shock.
MTS quant desk
Signals, options positioning and trade planning. Included with membership.
Quant signals
Rules-based signals on SPX, NDX, Gold, EUR/USD and GBP/USD, with tracked outcomes.
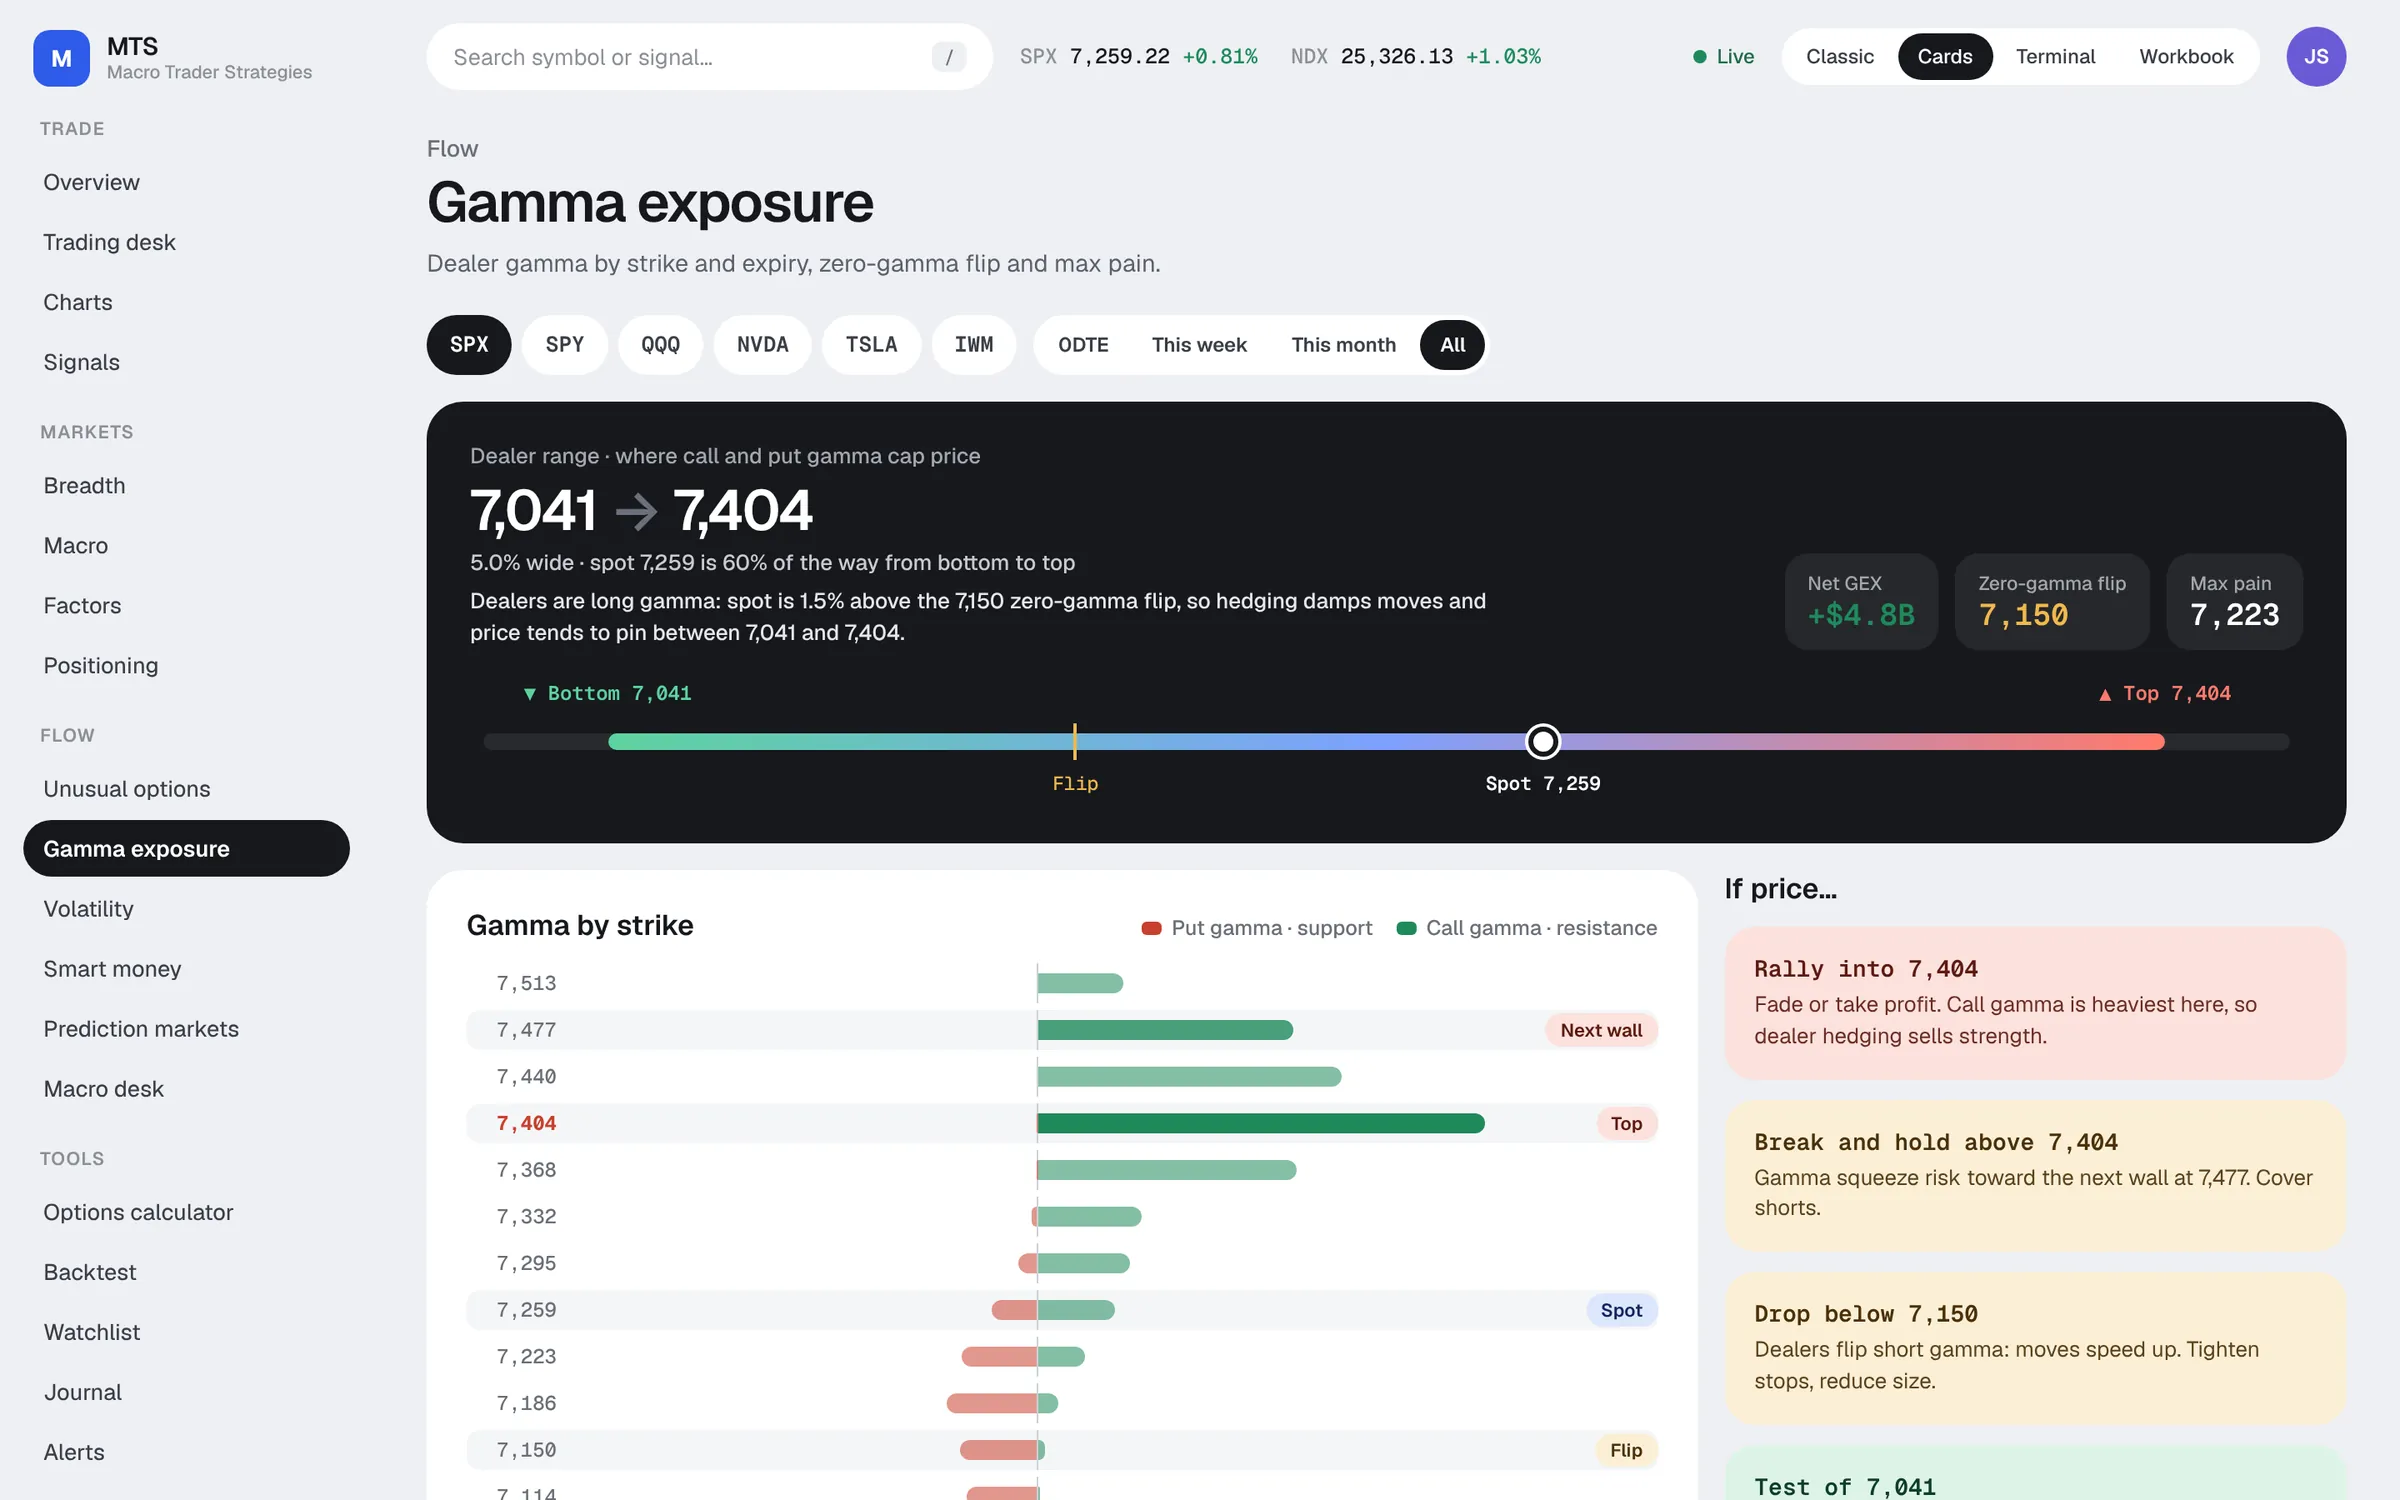
Dealer gamma
Gamma by strike, call and put walls and the flip level, including 0DTE.
Unusual options activity
Contracts trading far above open interest, with premium and implied side.
Volatility
VIX term structure, skew, expected moves and implied vs realised.
Max pain
The max-pain strike and open interest for the next six expiries.
Positioning
CFTC futures positioning alongside dealer exposure.
Macro Desk
Event-driven read-outs around major US data releases.
Strategy calculator
Multi-leg options P&L across price and time.
Stress-test housing and equities against the 10-year
The full interactive tool — every assumption editable — lives inside the terminal.
Yield shock
UK, US and Dubai housing, and equities, as the US 10-year movesLittle derating at this yield. Equities beat the bond by +5.1% a year in real terms. Holding wins unless the yield keeps moving.
- US 10-year 5.07% (FRED DGS10, 18 Nov 2026) and 30-year mortgage 7.28% (FRED MORTGAGE30US, 19 Nov 2026): spread 2.2, computed from those two series rather than typed in. Cash purchases 31.4% of US sales, Jan to Apr 2026 (Realtor.com): mortgage share 69%.
- UK gilt 5.34% (FRED IRLTLT01GBM156N, 1 Oct 2026), 0.3 over Treasuries. The model uses that live gap for both the gilt premium and the UK mortgage spread; the sourced cross-check is 2-year fix 5.59%, 5-year 5.63% (Moneyfacts, 2 Sep 2026), a spread of 0.4 at the time. 1.8m fixed deals expire in 2026 (UK Finance): 62% of the book over 36 months against an estimated 8.7m stock. Gross yield 5.8% (Zoopla).
- The “Today” preset is live: inflation 3.7% year on year (FRED CPIAUCSL (YoY), 1 Sep 2026) and an S&P 500 drawdown of 8% from its trailing 52-week high (Yahoo ^GSPC (52w high), 19 Nov 2026). Starting P/E 17.7x (Yahoo ^GSPC ÷ forward 12m EPS (eps-store, 2026-11-06), 19 Nov 2026). The 5%, 7%, 10% and 1981 presets keep their estimated inflation and drawdown pairings, as below.
- Dubai: 44,100 sales and 11,829 mortgage registrations in Q1 2026, 67% of resales cash (Cavendish Maxwell, DLD): mortgage share 30%. Off-plan 73% of Q1 and 76% of Q2 sales: 68% default. Gross yield 6.58% in July 2026. 120,000 units scheduled for 2026, 146,400 for 2027 (Fitch, Cavendish Maxwell), handovers running at 15 to 50% of schedule: net supply 2.5% of stock. Fitch expects up to 15% correction from supply alone. Mortgage spread 0.6: 3-month EIBOR 3.87% plus bank margins of 1.00 to 2.25% gives 4.9 to 5.6% variable (July 2026 rate sheets); fixed periods run 1 to 5 years then revert to EIBOR. Simplification: the model moves EIBOR with the US 10-year one for one.
- Estimates, not sourced: UK mortgage share 65%, US gross yield 5.6%, US reset share 8%, Dubai reset share 85% (inferred from 1 to 5 year fixes), net yield factors (UK 0.80, US 0.65, Dubai 0.77), preset inflation and equity drawdown pairings.
- Model coefficients with no source: channel weights (0.7 affordability, 0.6 cap-rate pass-through, 0.35 off-plan stress, 0.3 wealth), adjustment half-lives, wealth betas, verdict thresholds (35 and 60). Equity calibration check: fair P/E of 8.7x at 14% yield and 11% inflation against 8x in 1981.
- Outputs above 10% run heavier than the 1973 to 1977 and 1989 to 1993 UK episodes (real falls of 35 to 37%). Treat them as an upper bound. Monte Carlo uses constant volatility, so tail drawdowns are understated versus history. This is a scenario tool, not a forecast or investment advice.
Everybody’s wrong. Here’s the chart.
Free, rules-based backtests on real S&P 500 data — growth of $10,000 against the index, rebuilt every week. No sign-in, no email gate.
Buy Last Year's Losers
Each January, buy last year's 10 worst S&P 500 stocks. Do the beaten-down bounce back?
Chase Last Year's Winners
Each January, buy last year's 10 best S&P 500 stocks. Does momentum carry over?
Own the 10 Biggest
Each January, buy the 10 largest S&P 500 companies, equal weight. Do giants keep winning?
Missing the Best (and Worst) Days
What happens if you miss the 10 best days? The 10 worst? Time in market vs timing.
One plan. Both desks.
The full MacroHub terminal and the MTS quant desk, on one membership.
Pro
3-day free trial · $0 due today
- Full MacroHub terminal: macro, rates, earnings and valuation
- Stock research, screener and scenario lab
- Yield Shock and Oil Shock scenario tools
- Full backtest library of chart ideas
- MTS quant desk: signals, dealer gamma, options activity and volatility
- Market news feed
- All future features included
Need a team plan or custom integration? Contact us
Questions, answered
What is MacroHub?
MacroHub is a research terminal for macro traders. It puts the economy, rates, earnings, valuation and stock research in one place, so you can see the backdrop before you pick a trade.
What is MTS, and is it included?
MTS (Macro Trader Strategies) is our quant desk: signals, dealer gamma, options activity, volatility and positioning. It is included with every active MacroHub membership. Open it from the terminal with the Open MTS button, with no second login.
Where does the data come from? Is it real-time?
Macro series come from official sources such as FRED, and company fundamentals from SEC filings. MTS options tools use Cboe options data delayed by 15 minutes. Modelled figures such as dealer gamma and implied trade side are estimates, and the app labels them that way.
Does MTS show individual options trades or dark-pool prints?
Not today. MTS works from full options-chain snapshots (volume, open interest, premium and greeks), not a trade-by-trade tape. We would rather show a clearly labelled estimate than a feed we can't verify.
How does the free trial work?
You get a 3-day free trial with $0 due today. Billing runs through Whop, and you can cancel anytime there.
Is any of this financial advice?
No. MacroHub and MTS are research and education tools. Signals, backtests and scenarios are not recommendations to buy or sell, and past performance does not guarantee future results.
See the whole picture before you trade
Macro, positioning and planning in one place.